ehrapy.plot.variable_dependencies#
- ehrapy.plot.variable_dependencies(edata, *, layer, var_names=None, method='pearson', agg='mean', correction_method='bonferroni', alpha=0.05, abs_correlation_threshold=0.3, only_significant=True, width=600, height=600, cmap='RdBu_r', title=None)[source]#
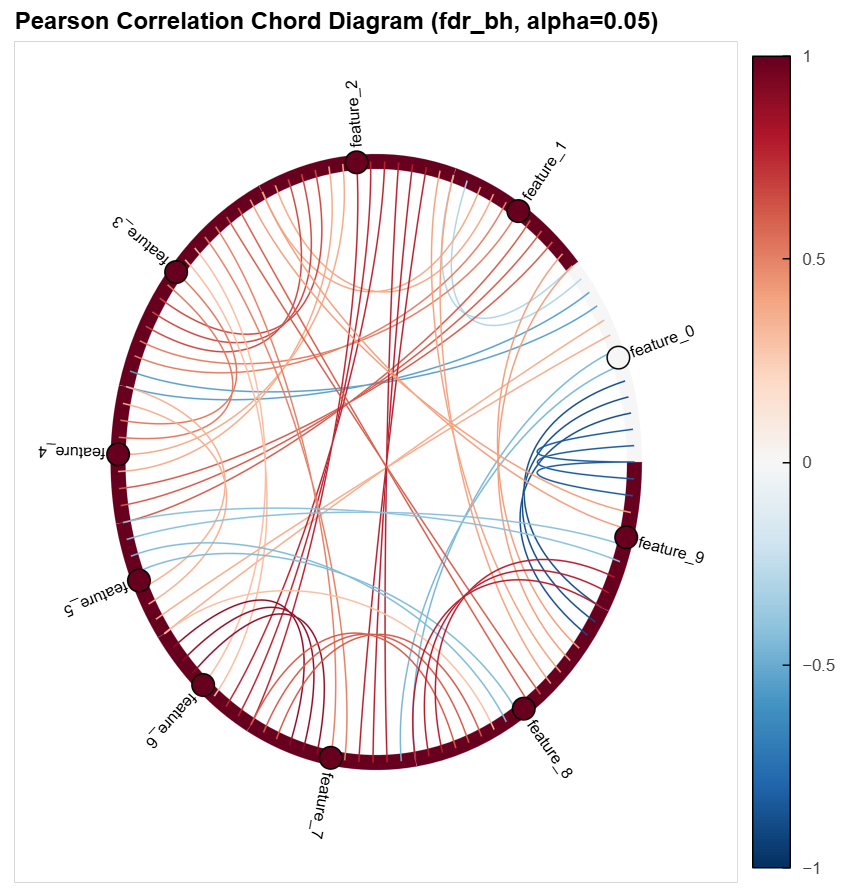
Plot correlation dependencies as a chord diagram.
Computes pairwise correlations between selected variables from layer and visualizes them as a chord diagram. If the layer contains a time dimension, values are aggregated per variable before correlation is computed.
- Parameters:
edata (
EHRData) – Central data object.layer (
str) – Layer to extract data from.var_names (
Sequence[str] |None, default:None) – List of variable names to compute correlation of. If None, uses all numeric variables.method (
Literal['spearman','pearson','kendall'], default:'pearson') – Correlation method: “spearman”, “kendall” or “pearson”.agg (
Literal['mean','last','first'], default:'mean') – How to aggregate time dimension: “mean”, “last” or “first”.correction_method (
Literal['bonferroni','fdr_bh','fdr_tsbh','holm','none'], default:'bonferroni') – Multiple testing correction method: * ‘bonferroni’ conservative Bonferroni correction. * ‘fdr_bh’ Benjamini-Hochberg false discovery rate (FDR) control. * ‘fdr_tsbh’ two-stage Benjamini-Hochberg, better calibrated when many variables are truly correlated. * ‘holm’ Holm-Bonferroni correction. * ‘none’ no multiple-testing correction.alpha (
float, default:0.05) – Significance threshold after correction.abs_correlation_threshold (
float, default:0.3) – Minimum absolute correlation to show a chord.only_significant (
bool, default:True) – If True, only show significant correlations.width (
int, default:600) – Plot width in pixels.height (
int, default:600) – Plot height in pixels.cmap (
str, default:'RdBu_r') – Colormap for the chord diagram.title (
str|None, default:None) – Set the title of the plot.
- Return type:
- Returns:
holoviews.element.Chordobject.
Examples
>>> import ehrdata as ed
>>> import ehrapy as ep
>>> edata = ed.dt.ehrdata_blobs(n_variables=10, n_centers=5, n_observations=200, base_timepoints=3)
>>> ep.pl.variable_dependencies(
...     edata, layer="tem_data", method="pearson", agg="mean", correction_method="fdr_bh"
... )