ehrapy.plot.rank_features_supervised#
- ehrapy.plot.rank_features_supervised(edata, key='feature_importances', n_features=10, ax=None, show=True, save=None, **kwargs)[source]#
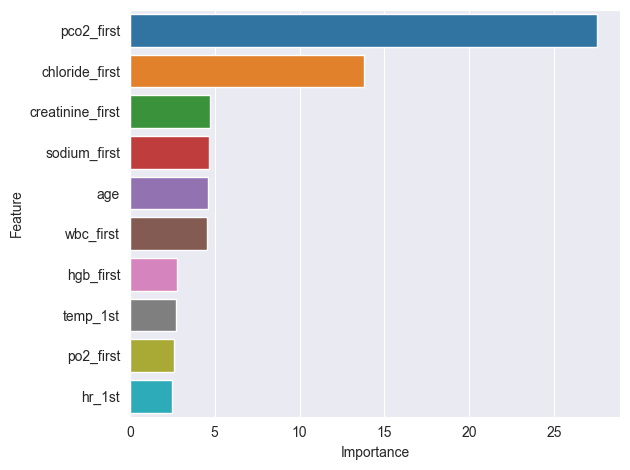
Plot features with greatest absolute importances as a barplot.
- Parameters:
edata (
EHRData) – Central data object. A key in edata.var should contain the feature importances, calculated beforehand.key (
str, default:'feature_importances') – The key in edata.var to use for feature importances.n_features (
int, default:10) – The number of features to plot.ax (
Axes|None, default:None) – A matplotlib axes object to plot on. If None, a new figure will be created.show (
bool, default:True) – If True, show the figure. If False, return the axes object.save (
str|None, default:None) – Path to save the figure. If None, the figure will not be saved.**kwargs – Additional arguments passed to seaborn.barplot.
- Return type:
- Returns:
If show == False a matplotlib.axes.Axes object, else None.
Examples
>>> import ehrdata as ed
>>> import ehrapy as ep
>>> edata = ed.dt.mimic_2()
>>> ep.pp.knn_impute(edata, n_neighbors=5)
>>> input_features = [
...     feat for feat in edata.var_names if feat not in {"service_unit", "day_icu_intime", "tco2_first"}
... ]
>>> ep.tl.rank_features_supervised(edata, "tco2_first", "rf", input_features=input_features)
>>> ep.pl.rank_features_supervised(edata)