ehrapy.plot.causal_effect#
- ehrapy.plot.causal_effect(estimate, *, other=None, title=None, width=520, height=260)[source]#
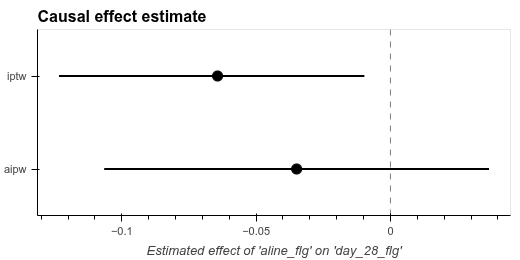
Plot a single causal estimate, or a comparison across estimators, as a forest-style plot.
With just
estimatethe plot is a single point estimate plus 95% confidence interval (when available). Withothersupplied one row per estimator is drawn so methods can be compared side by side.- Parameters:
estimate (
CausalEstimate) – The primaryCausalEstimateto display.other (
dict[str,CausalEstimate] |None, default:None) – Optional mapping{label: estimate}of additional estimates to plot below the primary one.title (
str|None, default:None) – Plot title. IfNone, defaults to"Causal effect estimate".width (
int, default:520) – Plot width in pixels.height (
int, default:260) – Plot height in pixels.
- Return type:
- Returns:
A
holoviews.Overlaycontaining the point estimates, confidence-interval segments, and zero-line.
Examples
>>> import ehrapy as ep
>>> import ehrdata as ed
>>> edata = ed.dt.mimic_2_preprocessed()
>>> covs = ["age", "sofa_first", "sapsi_first"]
>>> est_iptw = ep.tl.iptw(edata, "aline_flg", "day_28_flg", covariates=covs, random_state=0)
>>> est_aipw = ep.tl.aipw(edata, "aline_flg", "day_28_flg", covariates=covs)
>>> ep.pl.causal_effect(est_aipw, other={"iptw": est_iptw})
- Preview: