ehrapy.plot.catplot#
- ehrapy.plot.catplot(edata, x=None, y=None, hue=None, kind='strip', **kwargs)[source]#
Plot categorical data.
Wrapper around seaborn.catplot. Typically used to show the behaviour of one numerical variable with respect to one or several categorical variables.
Considers edata.obs only.
- Parameters:
edata (
EHRData) – Central data object.x (
str, default:None) – Variable to plot on the x-axis.y (
str, default:None) – Variable to plot on the y-axis.hue (
str, default:None) – Variable to plot as different colors.kind (
str, default:'strip') – Kind of plot to make. Options are: “point”, “bar”, “strip”, “swarm”, “box”, “violin”, “boxen”, or “count”.**kwargs – Keyword arguments for seaborn.catplot.
- Return type:
- Returns:
A Seaborn FacetGrid object for further modifications.
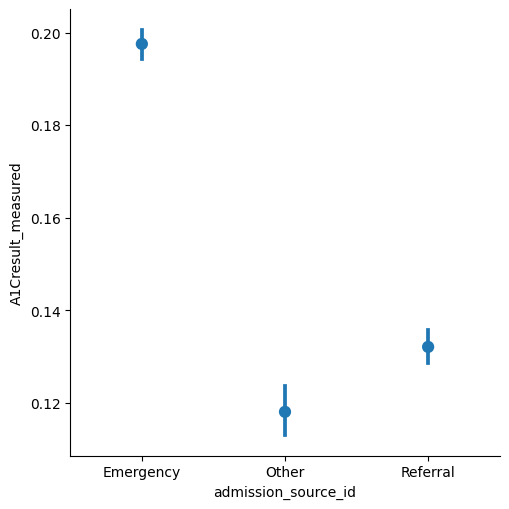
Examples
>>> import ehrdata as ed
>>> import ehrapy as ep
>>> edata = ed.dt.diabetes_130_fairlearn()
>>> ed.move_to_obs(edata, ["A1Cresult", "admission_source_id"], copy_columns=True)
>>> edata.obs["A1Cresult_measured"] = ~edata.obs["A1Cresult"].isna()
>>> ep.pl.catplot(
...     edata=edata,
...     y="A1Cresult_measured",
...     x="admission_source_id",
...     kind="point",
...     ci=95,
...     join=False,
... )