ehrapy.plot.stratified_table_one#
- ehrapy.plot.stratified_table_one(edata, *, key='stratified_table_one', n_cols=2, width=380, height=260, cmap='Category10', show_pvalues=True, **kwargs)[source]#
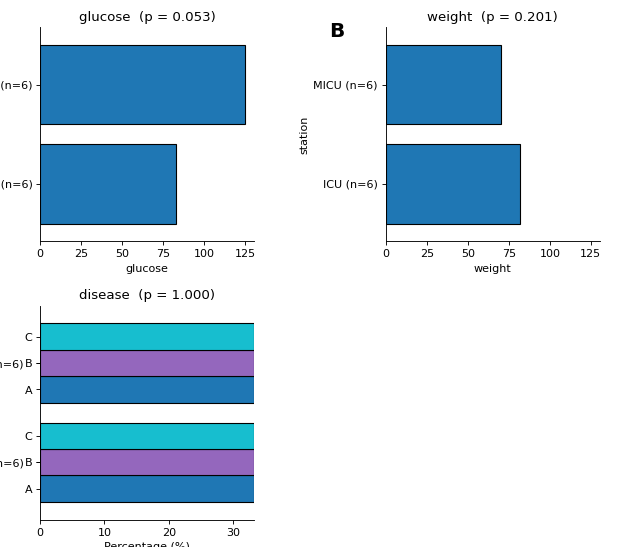
Plot the stratified “Table 1” baseline comparison stored by
stratified_table_one().Produces one panel per variable laid out in an
n_cols-columnholoviews.Layout:Categorical variables — stacked horizontal bars per group (percentage within group).
Continuous variables — one horizontal bar per group annotated with the summary (e.g.
mean (SD)ormedian [Q1, Q3]if listed innonnormal).
Each panel title includes the variable name and, when
show_pvalues=True, the per-variable p-value as reported bytableone.- Parameters:
edata (
EHRData) – Central data object containing results stored bystratified_table_one().key (
str, default:'stratified_table_one') – Key under which results are stored inedata.uns(matcheskey_added).n_cols (
int, default:2) – Number of columns in the panel layout.width (
int, default:380) – Width of each panel in pixels.height (
int, default:260) – Height of each panel in pixels.cmap (
str|list[str] |None, default:'Category10') – Colormap (name or explicit color list) used for categories.show_pvalues (
bool, default:True) – Whether to append the p-value to each panel title.**kwargs – Additional
.opts(...)styling forwarded to every panel.
- Return type:
- Returns:
HoloViews Layout of per-variable panels.
Examples
>>> import ehrdata as ed
>>> import ehrapy as ep
>>> edata = ed.dt.diabetes_130_fairlearn(
...     columns_obs_only=["gender", "race", "age", "readmit_binary", "num_procedures"]
... )
>>> ep.tl.stratified_table_one(
...     edata,
...     groupby="readmit_binary",
...     columns=["gender", "race", "age", "num_procedures"],
...     nonnormal=["num_procedures"],
... )
>>> ep.pl.stratified_table_one(edata)