ehrapy.plot.scatter#
- ehrapy.plot.scatter(edata, x=None, y=None, *, color=None, use_raw=None, layers=None, sort_order=True, alpha=None, basis=None, groups=None, components=None, projection='2d', legend_loc='right margin', legend_fontsize=None, legend_fontweight=None, legend_fontoutline=None, color_map=None, palette=None, frameon=None, right_margin=None, left_margin=None, size=None, title=None, show=None, save=None, ax=None)[source]#
Scatter plot along observations or variables axes.
Color the plot using annotations of observations (.obs), variables (.var) or features (.var_names).
- Parameters:
edata (
EHRData) – Central data object.color (
str|None, default:None) – Keys for annotations of observations/patients or features, or a hex color specification, e.g., ‘ann1’, ‘#fe57a1’, or [‘ann1’, ‘ann2’].use_raw (
bool|None, default:None) – Whether to use raw attribute of edata. Defaults to True if .raw is present.layers (
str|Collection[str] |None, default:None) – Use the layers attribute of edata if present: specify the layer for x, y and color. If layers is a string, then it is expanded to (layers, layers, layers).basis (
Literal['pca','tsne','umap','diffmap','draw_graph_fr'] |None, default:None) – String that denotes a plotting tool that computed coordinates.sort_order (
bool, default:True) – For continuous annotations used as color parameter, plot data points with higher values on top of others.groups (
str|Iterable[str] |None, default:None) – Restrict to a few categories in categorical observation annotation. The default is not to restrict to any groups.components (
str|Collection[str] |None, default:None) – For instance, [‘1,2’, ‘2,3’]. To plot all available components use components=’all’.projection (
Literal['2d','3d'], default:'2d') – Projection of plot (default: ‘2d’).legend_loc (
str, default:'right margin') – Location of legend, either ‘on data’, ‘right margin’ or a valid keyword for the loc parameter ofLegend.legend_fontsize (
int|float|Literal['xx-small','x-small','small','medium','large','x-large','xx-large'] |None, default:None) – Numeric size in pt or string describing the size. Seeset_fontsize().legend_fontweight (
int|Literal['light','normal','medium','semibold','bold','heavy','black'] |None, default:None) – Legend font weight. A numeric value in range 0-1000 or a string. Defaults to ‘bold’ if legend_loc == ‘on data’, otherwise to ‘normal’. Seeset_fontweight().legend_fontoutline (
float|None, default:None) – Line width of the legend font outline in pt. Draws a white outline using the path effectwithStroke.size (
int|float|None, default:None) – Point size. If None, is automatically computed as 120000 / n_features.Can be a sequence containing the size for each observation. The order should be the same as in edata.obs.color_map (
str|Colormap|None, default:None) – Color map to use for continous variables. Can be a name or aColormapinstance (e.g. “magma”, “viridis” or mpl.cm.cividis), seeget_cmap(). If None, the value of mpl.rcParams[“image.cmap”] is used. The default color_map can be set usingset_figure_params().palette (
Cycler|ListedColormap|str|tuple[float,...] |Sequence[str|tuple[float,...]] |None, default:None) – Colors to use for plotting categorical annotation groups. The palette can be a validListedColormapname (‘Set2’, ‘tab20’, …), aCyclerobject, a dict mapping categories to colors, or a sequence of colors. Colors must be valid to matplotlib. (seeis_color_like()). If None, mpl.rcParams[“axes.prop_cycle”] is used unless the categorical variable already has colors stored in edata.uns[“{{var}}_colors”]. If provided, values of edata.uns[“{{var}}_colors”] will be set.na_color – Color to use for null or masked values. Can be anything matplotlib accepts as a color. Used for all points if color=None.
na_in_legend – If there are missing values, whether they get an entry in the legend. Currently only implemented for categorical legends.
frameon (
bool|None, default:None) – Draw a frame around the scatter plot. Defaults to value set inset_figure_params()(default: True).title (
str|None, default:None) – Provide title for panels either as string or list of strings, e.g. [‘title1’, ‘title2’, …].show (
bool|None, default:None) – Whether to display the figure or return axis.save (
str|bool|None, default:None) – If True or a str, save the figure. A string is appended to the default filename. Infer the filetype if ending on {‘.pdf’, ‘.png’, ‘.svg’}.ax (
Axes|None, default:None) – A matplotlib axes object. Only works if plotting a single component.
Example
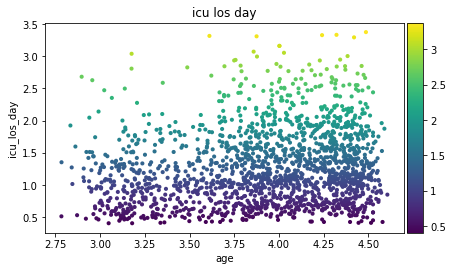
import ehrdata as ed
import ehrapy as ep

edata = ed.dt.mimic_2()
ep.pp.knn_impute(edata)
ep.pp.log_norm(edata, offset=1)
ep.pp.neighbors(edata)
ep.pl.scatter(edata, x="age", y="icu_los_day", color="icu_los_day")
- Preview: