ehrapy.plot.ncp#
- ehrapy.plot.ncp(edata, *, key='ncp', n_top=12, width=380, height=280)[source]#
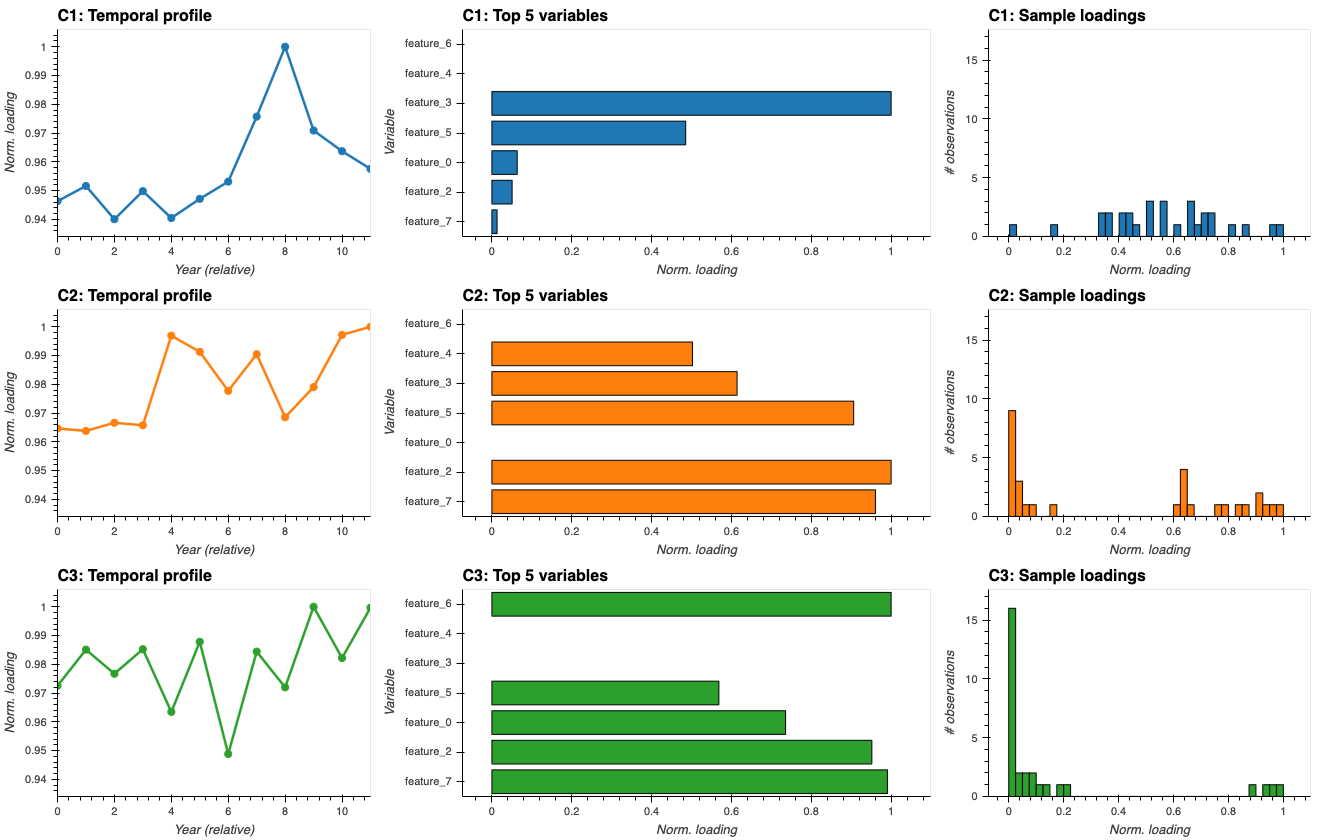
Plot the factors from a Non-negative CP decomposition.
Produces one row of three panels per component, laid out as
rank × 3panels in a fixed three-column grid:- Panel 1 — Temporal profile (line chart)
The normalised temporal factor
c_rfor component r, plotted against the relative time axis. Each value shows how the collective influence of this component rises or falls at that time point. A rising curve indicates a condition that worsens (or becomes more prevalent) over time; a peaked curve suggests a transient event; a flat curve indicates a time-independent pattern.- Panel 2 — Top variables (horizontal bar chart)
The
n_topclinical variables with the highest normalised loadingb_rfor component r, sorted by loading magnitude. These are the variables that best characterise the component — i.e. the diseases, measurements, or features that tend to co-occur in the patient sub-group captured by this component.- Panel 3 — Sample loadings (histogram)
Distribution of the patient-level loading
a_racross all observations. A spike near zero with a heavy right tail means the component is selective — only a sub-group of patients expresses it. A broad, roughly uniform distribution means the component is diffuse — relevant to most patients to varying degrees.
All three factor vectors are normalised to
[0, 1]before plotting so that components with different absolute scales are visually comparable.Requires
ncp()to have been run first.- Parameters:
edata (
EHRData) – Central data object containing NCP results.key (
str, default:'ncp') – Key under which NCP results are stored (matcheskey_addedinncp()).n_top (
int, default:12) – Number of top-loaded variables to display per component.width (
int, default:380) – Width of each individual panel in pixels.height (
int, default:280) – Height of each individual panel in pixels.
- Return type:
- Returns:
HoloViews Layout with
rank × 3panels arranged in three columns.
Examples
>>> import ehrdata as ed, ehrapy as ep
>>> edata = ed.dt.ehrdata_blobs(n_variables=8, n_centers=3, n_observations=30, base_timepoints=12)
>>> ep.tl.ncp(edata, layer="tem_data", rank=3, sigmoid_transform=True)
>>> ep.pl.ncp(edata, n_top=5)