ehrapy.plot.cox_ph_forestplot#
- ehrapy.plot.cox_ph_forestplot(edata, *, uns_key='cox_ph', labels=None, width=1200, height=600, ecolor='dimgray', size=3, marker='o', decimal=2, text_size=12, color='k', title=None)[source]#
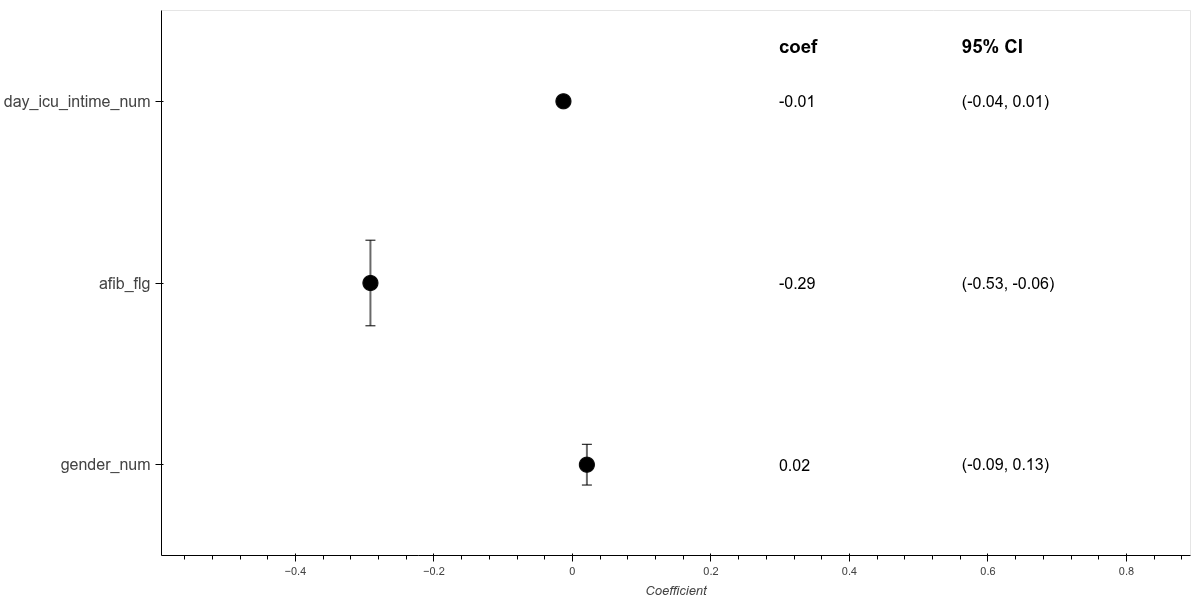
Generates a forest plot to visualize the coefficients and confidence intervals of a Cox Proportional Hazards model.
The edata object must first be populated using the
cox_ph()function. This function stores the summary table of the CoxPHFitter in the .uns attribute of edata. The summary table is created when the model is fitted using thecox_ph()function. See also:CoxPHFitter- Parameters:
edata (
EHRData) – Data object containing the summary table from the CoxPHFitter. This is stored in the .uns attribute, after fitting the model usingcox_ph().uns_key (
str, default:'cox_ph') – Key in .uns wherecox_ph()function stored the summary table. See argument uns_key incox_ph().labels (
Iterable[str] |None, default:None) – List of labels for each coefficient, default uses the index of the summary table.width (
int, default:1200) – Plot width in pixels.height (
int, default:600) – Plot height in pixels.ecolor (
str, default:'dimgray') – Color of the error bars.size (
int, default:3) – Size of the markers.marker (
str, default:'o') – Marker style.decimal (
int, default:2) – Number of decimal places to display.text_size (
int, default:12) – Font size of the text.color (
str, default:'k') – Color of the markers.title (
str|None, default:None) – Set the title of the plot.
- Return type:
- Returns:
HoloViews Overlay with forest plot and text annotations.
Examples
>>> import ehrdata as ed
>>> import ehrapy as ep
>>> edata = ed.dt.mimic_2()[
...     :, ["mort_day_censored", "censor_flg", "gender_num", "afib_flg", "day_icu_intime_num"]
... ]
>>> coxph = ep.tl.cox_ph(edata, event_col="censor_flg", duration_col="mort_day_censored")
>>> ep.pl.cox_ph_forestplot(edata)