ehrapy.plot.love_plot#
- ehrapy.plot.love_plot(balance, *, threshold=0.1, title=None, width=520, height=None)[source]#
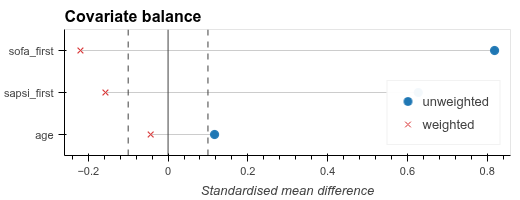
Plot a “love plot” of standardised mean differences before and after weighting.
Covariates are drawn on the y-axis sorted by their unweighted absolute SMD, with vertical guide lines at
±threshold(commonly 0.1).- Parameters:
balance (
DataFrame) – Output ofcovariate_balance(), a DataFrame indexed by covariate name withsmd_unweightedandsmd_weightedcolumns.threshold (
float, default:0.1) – SMD magnitude used for the dashed guide lines.title (
str|None, default:None) – Plot title. IfNone, defaults to"Covariate balance".width (
int, default:520) – Plot width in pixels.height (
int|None, default:None) – Plot height in pixels. IfNone,heightis set to28 * n_covariates + 80.
- Return type:
- Returns:
A
holoviews.Overlaycontaining the scatter points, connecting lines, and guide lines.
Examples
>>> import ehrapy as ep
>>> import ehrdata as ed
>>> edata = ed.dt.mimic_2_preprocessed()
>>> bal = ep.tl.covariate_balance(
...     edata,
...     "aline_flg",
...     covariates=["age", "sofa_first", "sapsi_first"],
... )
>>> ep.pl.love_plot(bal)
- Preview: