ehrapy.plot.propensity_overlap#
- ehrapy.plot.propensity_overlap(positivity, *, bins=40, title=None, width=520, height=320)[source]#
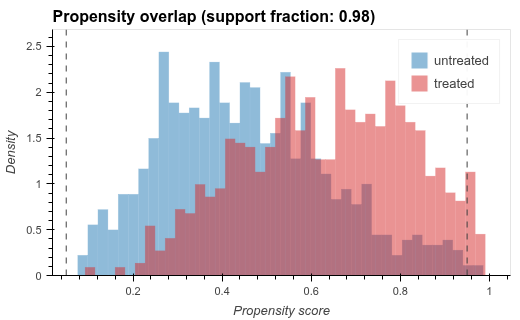
Plot overlapping propensity score histograms for treated and untreated groups.
Use the dict returned by
positivity_check(). A lack of overlap between the two arms is the visual signature of a positivity violation.- Parameters:
positivity (
dict) – Output ofpositivity_check().bins (
int, default:40) – Number of histogram bins per arm.title (
str|None, default:None) – Plot title. IfNone, defaults to a string describing the support fraction.width (
int, default:520) – Plot width in pixels.height (
int, default:320) – Plot height in pixels.
- Return type:
- Returns:
A
holoviews.Overlaycontaining one histogram per arm and the support-boundary guide lines.
Examples
>>> import ehrapy as ep
>>> import ehrdata as ed
>>> edata = ed.dt.mimic_2_preprocessed()
>>> info = ep.tl.positivity_check(
...     edata,
...     "aline_flg",
...     covariates=["age", "sofa_first", "sapsi_first"],
... )
>>> ep.pl.propensity_overlap(info)
- Preview: