ehrapy.plot.pca_variance_ratio#
- ehrapy.plot.pca_variance_ratio(edata, n_pcs=30, log=False, show=None, save=None)[source]#
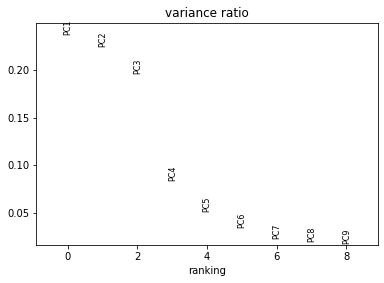
Plot the variance ratio.
- Parameters:
edata (
EHRData) – Central data object.n_pcs (
int, default:30) – Number of PCs to show.log (
bool, default:False) – Plot on logarithmic scale..show (
bool|None, default:None) – Show the plot, do not return axis.save (
bool|str|None, default:None) – If True or a str, save the figure. A string is appended to the default filename. Infer the filetype if ending on {‘.pdf’, ‘.png’, ‘.svg’}.
- Return type:
Examples
>>> import ehrdata as ed
>>> import ehrapy as ep
>>> edata = ed.dt.mimic_2()
>>> ep.pp.knn_impute(edata)
>>> ep.pp.log_norm(edata, offset=1)
>>> ep.pp.neighbors(edata)
>>> ep.pp.pca(edata)
>>> ep.pl.pca_variance_ratio(edata, n_pcs=8)
- Preview: