ehrapy.plot.ols#
- ehrapy.plot.ols(edata=None, *, x=None, y=None, scatter_plot=True, ols_results=None, ols_color=None, xlabel=None, ylabel=None, width=600, height=400, lines=None, lines_color=None, lines_style=None, lines_label=None, xlim=None, ylim=None, title=None, **kwds)[source]#
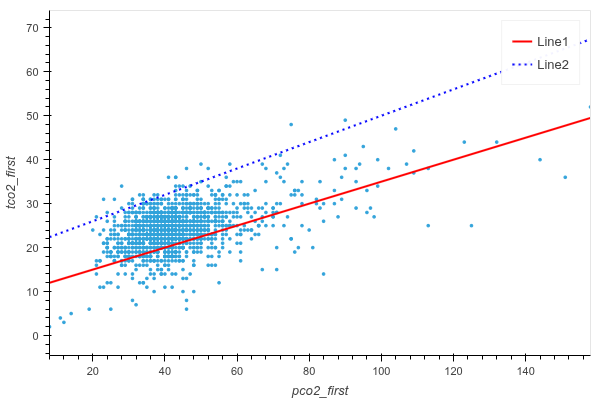
Plots an Ordinary Least Squares (OLS) Model result, scatter plot, and line plot.
- Parameters:
edata (
EHRData|None, default:None) – Central data object.x (
str|None, default:None) – x coordinate, for scatter plotting.y (
str|None, default:None) – y coordinate, for scatter plotting.scatter_plot (
bool|None, default:True) – Whether to show a scatter plot.ols_results (
list[RegressionResults] |None, default:None) – List of RegressionResults from ehrapy.tl.ols.ols_color (
list[str|None] |None, default:None) – List of colors for each ols_results.lines (
list[tuple[ndarray|float,ndarray|float]] |None, default:None) – List of Tuples of (slope, intercept) or (x, y). Plot lines by slope and intercept or data points. Example: plot two lines (y = x + 2 and y = 2*x + 1): [(1, 2), (2, 1)]lines_color (
list[str|None] |None, default:None) – List of colors for each line.lines_style (
list[str|None] |None, default:None) – List of line styles for each line.lines_label (
list[str|None] |None, default:None) – List of line labels for each line.xlim (
tuple[float,float] |None, default:None) – Set the x-axis view limits. Required for only plotting lines using slope and intercept.ylim (
tuple[float,float] |None, default:None) – Set the y-axis view limits. Required for only plotting lines using slope and intercept.title (
str|None, default:None) – Set the title of the plot.**kwds – Passed to HoloViews Scatter element.
- Return type:
Examples
>>> import ehrdata as ed
>>> import ehrapy as ep
>>> edata = ed.dt.mimic_2()
>>> co2_lm_result = ep.tl.ols(
...     edata, var_names=["pco2_first", "tco2_first"], formula="tco2_first ~ pco2_first", missing="drop"
... ).fit()
>>> ep.pl.ols(
...     edata,
...     x="pco2_first",
...     y="tco2_first",
...     ols_results=[co2_lm_result],
...     ols_color=["red"],
...     xlabel="PCO2",
...     ylabel="TCO2",
... )