ehrapy.plot.rank_features_groups_heatmap#
- ehrapy.plot.rank_features_groups_heatmap(edata, groups=None, n_features=None, groupby=None, feature_symbols=None, var_names=None, min_logfoldchange=None, key=None, show=None, save=None, **kwds)[source]#
Plot ranking of genes using heatmap plot (see
heatmap()).- Parameters:
edata (
EHRData) – Central data object.groups (
str|Sequence[str] |None, default:None) – List of group names.n_features (
int|None, default:None) – Number of features to show. Is ignored if feature_names is passed.groupby (
str|None, default:None) – Which key to group the features by.feature_symbols (
str|None, default:None) – Key for field in .var that stores feature symbols if you do not want to use .var_names displayed in the plot.var_names (
Sequence[str] |Mapping[str,Sequence[str]] |None, default:None) – Feature names.min_logfoldchange (
float|None, default:None) – Minimum log fold change to consider.key (
str|None, default:None) – The key of the calculated feature group rankings (default: ‘rank_features_groups’).show (
bool|None, default:None) – Whether to show the plot.**kwds – Passed to
heatmap().
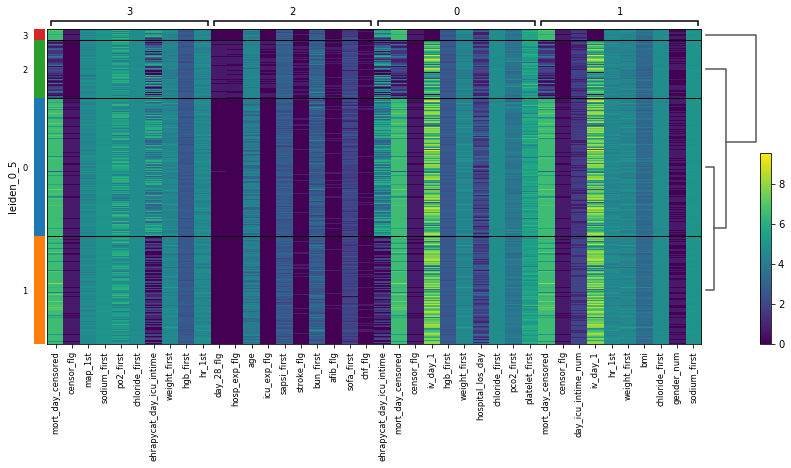
Examples
>>> import ehrdata as ed
>>> import ehrapy as ep
>>> edata = ed.dt.mimic_2()
>>> ep.pp.knn_impute(edata)
>>> ep.pp.log_norm(edata, offset=1)
>>> ep.pp.neighbors(edata)
>>> ep.tl.leiden(edata, resolution=0.15, key_added="leiden_0_5")
>>> ep.tl.rank_features_groups(edata, groupby="leiden_0_5")
>>> ep.pl.rank_features_groups_heatmap(edata, key="rank_features_groups")
- Preview: