ehrapy.tools.CohortTracker
- class ehrapy.tools.CohortTracker(adata, columns=None, categorical=None)[source]
Track cohort changes over multiple filtering or processing steps.
This class offers functionality to track and plot cohort changes over multiple filtering or processing steps, enabling the user to monitor the impact of each step on the cohort.
Tightly interacting with the tableone package [1].
- Parameters:
References
[1] Tom Pollard, Alistair E.W. Johnson, Jesse D. Raffa, Roger G. Mark; tableone: An open source Python package for producing summary statistics for research papers, Journal of the American Medical Informatics Association, Volume 24, Issue 2, 1 March 2017, Pages 267–271, https://doi.org/10.1093/jamia/ocw117
Attributes table
Number of tracked steps. |
|
List of |
Methods table
|
Plot the cohort change over the tracked steps. |
|
Flowchart over the tracked steps. |
Attributes
tracked_steps
- CohortTracker.tracked_steps
Number of tracked steps.
tracked_tables
- CohortTracker.tracked_tables
List of
TableOneobjects of each logging step.
Methods
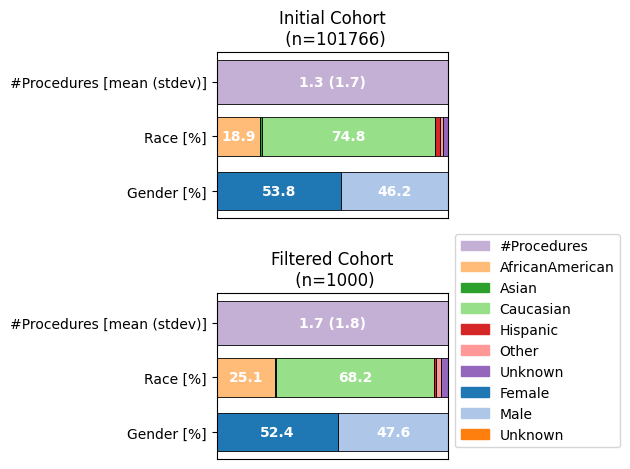
plot_cohort_barplot
- CohortTracker.plot_cohort_barplot(subfigure_title=False, color_palette='colorblind', yticks_labels=None, legend_labels=None, legend_subtitles=False, legend_subtitles_names=None, show=True, ax=None, fontsize=10, subplots_kwargs=None, legend_kwargs=None)[source]
Plot the cohort change over the tracked steps.
Create stacked bar plots to monitor cohort changes over the steps tracked with CohortTracker.
- Parameters:
subfigure_title (
bool) – If True, each subplot will have a title with the label provided during tracking.color_palette (
str) – The color palette to use for the plot. Default is “colorblind”.yticks_labels (
dict) – Dictionary to rename the axis labels. If None, the original labels will be used. The keys should be the column names.legend_labels (
dict) – Dictionary to rename the legend labels. If None, the original labels will be used. For categoricals, the keys should be the categories. For numericals, the key should be the column name.legend_subtitles (
bool) – If True, subtitles will be added to the legend. Default is False.legend_subtitles_names (
dict) – Dictionary to rename the legend subtitles. If None, the original labels will be used. The keys should be the column names.show (
bool) – If True, the plot will be shown. If False, plotting handels are returned.ax (
Axes|Sequence[Axes]) – If None, a new figure and axes will be created. If an axes object is provided, the plot will be added to it.fontsize (
int) – Fontsize for the text in the plot. Default is 10.subplots_kwargs (
dict) – Additional keyword arguments for the subplots.legend_kwargs (
dict) – Additional keyword arguments for the legend.
- Return type:
- Returns:
If show=True, returns None. Else, if no ax is passed, returns a tuple (
Figure,Axes), else aAxes).
Examples
>>> import ehrapy as ep
>>> adata = ep.dt.diabetes_130_fairlearn(columns_obs_only=["gender", "race", "num_procedures"])
>>> cohort_tracker = ep.tl.CohortTracker(adata, categorical=["gender", "race"])
>>> cohort_tracker(adata, "Initial Cohort")
>>> adata = adata[:1000]
>>> cohort_tracker(adata, "Filtered Cohort")
>>> cohort_tracker.plot_cohort_barplot(
...     subfigure_title=True,
...     color_palette="tab20",
...     yticks_labels={
...         "race": "Race [%]",
...         "gender": "Gender [%]",
...         "num_procedures": "#Procedures [mean (stdev)]",
...     },
...     legend_labels={
...         "Unknown/Invalid": "Unknown",
...         "num_procedures": "#Procedures",
...     },
...     legend_kwargs={"bbox_to_anchor": (1, 1.4)},
... )
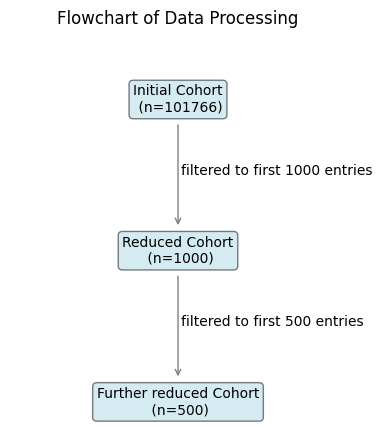
plot_flowchart
- CohortTracker.plot_flowchart(title=None, arrow_size=0.7, show=True, ax=None, bbox_kwargs=None, arrowprops_kwargs=None)[source]
Flowchart over the tracked steps.
Create a simple flowchart of data preparation steps tracked with CohortTracker.
- Parameters:
arrow_size (
float) – The size of the arrows in the plot. Default is 0.7.show (
bool) – If True, the plot will be displayed. If False, plotting handels are returned.ax (
Axes) – If None, a new figure and axes will be created. If an axes object is provided, the plot will be added to it.bbox_kwargs (
dict) – Additional keyword arguments for the node boxes.arrowprops_kwargs (
dict) – Additional keyword arguments for the arrows.
- Return type:
- Returns:
If show=True, returns None. Else, if no ax is passed, returns a tuple (
Figure,Axes), else aAxes).
Examples
>>> import ehrapy as ep
>>> adata = ep.dt.diabetes_130_fairlearn(columns_obs_only="gender", "race")
>>> cohort_tracker = ep.tl.CohortTracker(adata)
>>> cohort_tracker(adata, label="Initial Cohort")
>>> adata = adata[:1000]
>>> cohort_tracker(adata, label="Reduced Cohort", operations_done="filtered to first 1000 entries")
>>> adata = adata[:500]
>>> cohort_tracker(
...     adata,
...     label="Further reduced Cohort",
...     operations_done="filtered to first 500 entries",
... )
>>> cohort_tracker.plot_flowchart(title="Flowchart of Data Processing", show=True)