ehrapy.plot.dpt_timeseries
- ehrapy.plot.dpt_timeseries(adata, color_map=None, as_heatmap=True, show=None, save=None)[source]
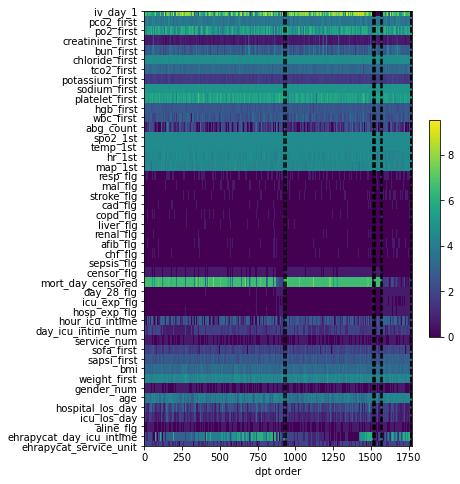
Heatmap of pseudotime series.
- Parameters:
Examples
>>> import ehrapy as ep
>>> import numpy as np
>>> adata = ep.dt.mimic_2(encoded=True)
>>> ep.pp.knn_impute(adata)
>>> ep.pp.log_norm(adata, offset=1)
>>> ep.pp.neighbors(adata, method="gauss")
>>> ep.tl.leiden(adata, resolution=0.5, key_added="leiden_0_5")
>>> ep.tl.diffmap(adata, n_comps=10)
>>> adata.uns["iroot"] = np.flatnonzero(adata.obs["leiden_0_5"] == "0")[0]
>>> ep.tl.dpt(adata, n_branchings=3)
>>> ep.pl.dpt_timeseries(adata)
- Preview: