ehrapy.plot.missing_values_matrix
- ehrapy.plot.missing_values_matrix(adata, *, filter=None, max_cols=0, max_percentage=0, sort=None, figsize=(25, 10), width_ratios=(15, 1), color=(0.25, 0.25, 0.25), fontsize=16, labels=True, label_rotation=45, sparkline=True, categoricals=False)[source]
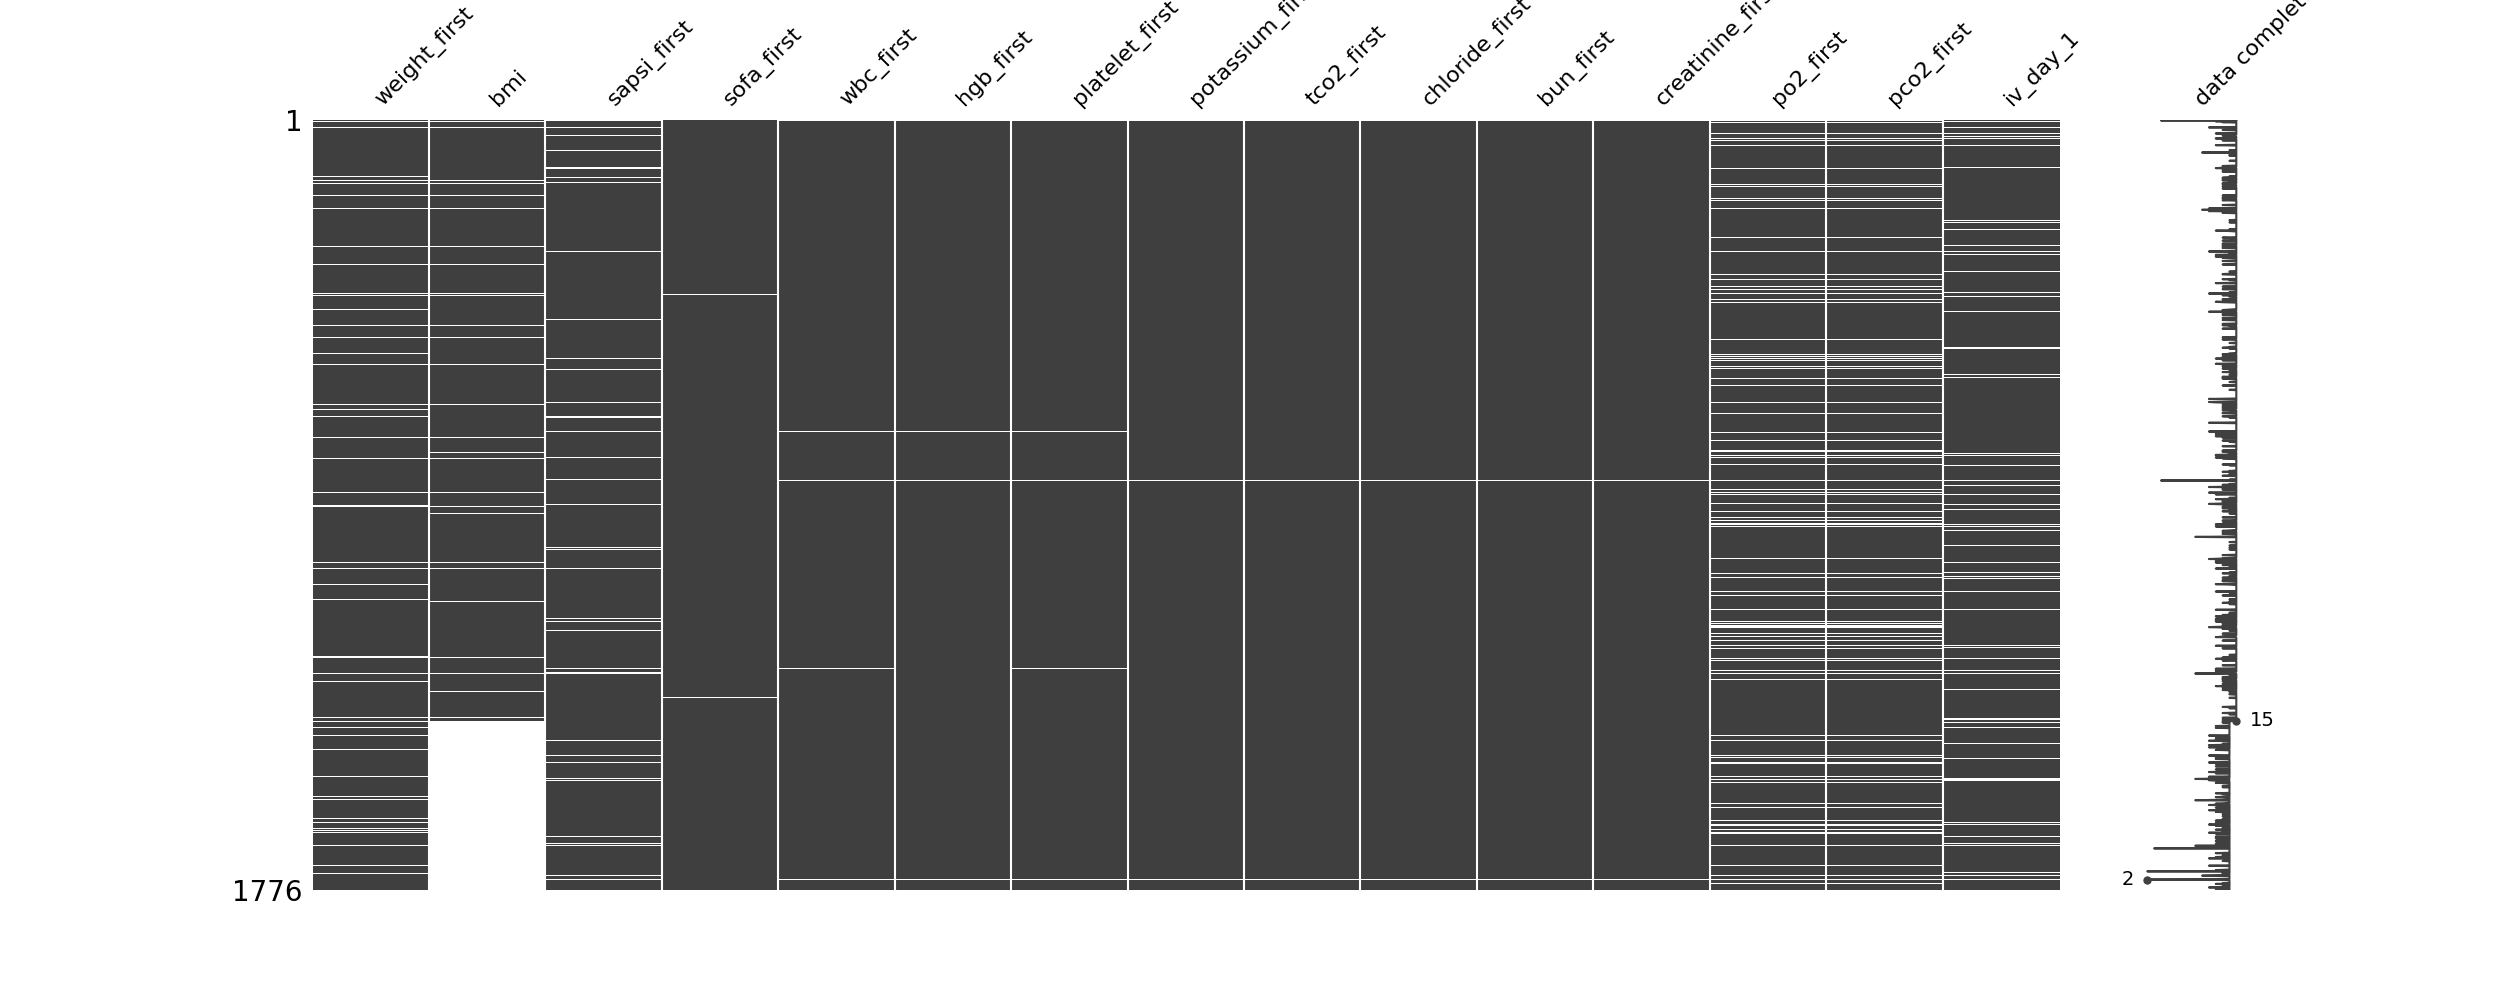
A matrix visualization of the nullity of the given AnnData object.
- Parameters:
adata (
AnnData) –AnnDataobject containing all observations.filter (
str|None) – The filter to apply to the matrix. Should be one of “top”, “bottom”, or None. Defaults to None .max_cols (
int) – The max number of columns from the AnnData object to include.max_percentage (
float) – The max percentage fill of the columns from the AnnData object.sort (
str|None) – The row sort order to apply. Can be “ascending”, “descending”, or None.figsize (
tuple) – The size of the figure to display.width_ratios (
tuple) – The ratio of the width of the matrix to the width of the sparkline.color (
tuple) – The color of the filled columns.fontsize (
float) – The figure’s font size.labels (
bool) – Whether or not to display the column names.label_rotation (
float) – What angle to rotate the text labels to.sparkline (
bool) – Whether or not to display the sparkline.categoricals (
bool) – Whether to include “ehrapycat” columns to the plot.
- Returns:
The plot axis.
Examples
>>> import ehrapy as ep
>>> adata = ep.dt.mimic_2(encoded=True)
>>> ep.pl.missing_values_matrix(adata, filter="bottom", max_cols=15, max_percentage=0.999)
- Preview: