ehrapy.plot.violin
- ehrapy.plot.violin(adata, keys, groupby=None, log=False, use_raw=None, stripplot=True, jitter=True, size=1, layer=None, scale='width', order=None, multi_panel=None, xlabel='', ylabel=None, rotation=None, show=None, save=None, ax=None, **kwds)[source]
Violin plot.
Wraps
seaborn.violinplot()forAnnData.- Parameters:
adata (
AnnData) –AnnDataobject object containing all observations.keys (
str|Sequence[str]) – Keys for accessing variables of .var_names or fields of .obs.groupby (
str|None) – The key of the observation grouping to consider.log (
bool) – Plot on logarithmic axis.use_raw (
bool|None) – Whether to use raw attribute of adata. Defaults to True if .raw is present.stripplot (
bool) – Add a stripplot on top of the violin plot. Seestripplot().jitter (
float|bool) – Add jitter to the stripplot (only when stripplot is True) Seestripplot().size (
int) – Size of the jitter points.layer (
str|None) – Name of the AnnData object layer that wants to be plotted. By default adata.raw.X is plotted. If use_raw=False is set, then adata.X is plotted. If layer is set to a valid layer name, then the layer is plotted. layer takes precedence over use_raw.scale (
Literal['area','count','width']) – The method used to scale the width of each violin. If ‘width’ (the default), each violin will have the same width. If ‘area’, each violin will have the same area. If ‘count’, a violin’s width corresponds to the number of observations.order (
Sequence[str] |None) – Order in which to show the categories.multi_panel (
bool|None) – Display keys in multiple panels also when groupby is not None.xlabel (
str) – Label of the x axis. Defaults to groupby if rotation is None, otherwise, no label is shown.ylabel (
str|Sequence[str] |None) – Label of the y axis. If None and groupby is None, defaults to ‘value’. If None and groubpy is not None, defaults to keys.{show_save_ax}
**kwds – Are passed to
violinplot().
- Returns:
A
Axesobject if ax is None else None.
Example
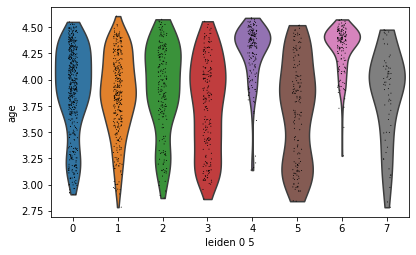
import ehrapy as ep

adata = ep.dt.mimic_2(encoded=True)
ep.pp.knn_impute(adata)
ep.pp.log_norm(adata, offset=1)
ep.pp.neighbors(adata)
ep.tl.leiden(adata, resolution=0.5, key_added="leiden_0_5")
ep.pl.violin(adata, keys=["age"], groupby="leiden_0_5")
- Preview: