ehrapy.plot.ncp_cluster_trajectories#
- ehrapy.plot.ncp_cluster_trajectories(edata, *, layer, cluster_key, key='ncp', n_top_diseases=5, sigmoid_transform=False, width=520, height=300)[source]#
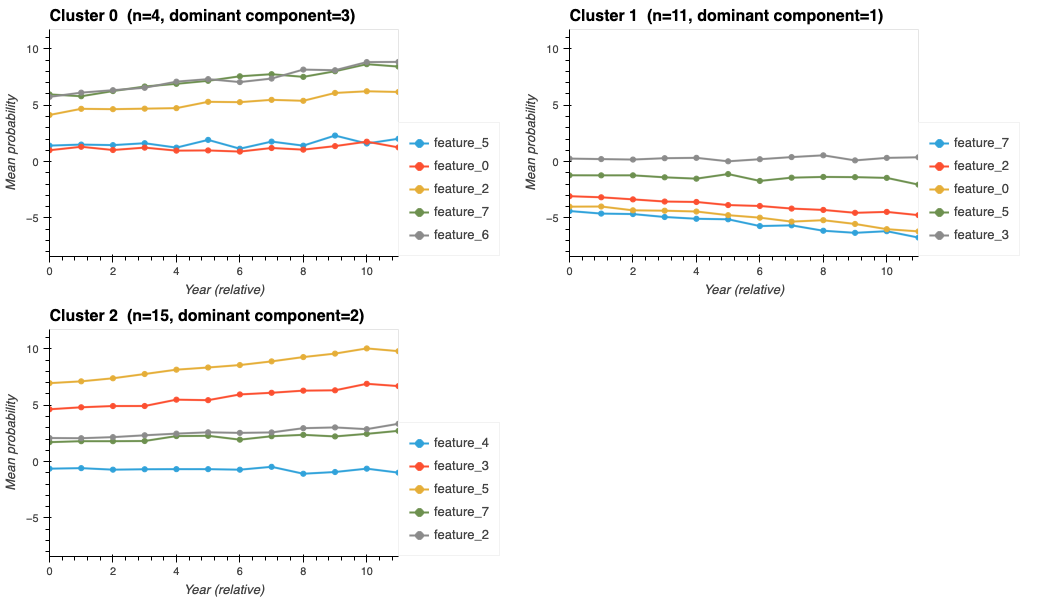
Plot mean variable trajectories per cluster, guided by NCP loadings.
This function bridges unsupervised NCP decomposition and an existing cluster assignment (e.g. from
sc.tl.leidenor a clinical grouping): for each cluster it identifies which NCP component best represents that cluster, selects the top variables of that component, and visualises their mean trajectories over the time axis — all from the raw data, not the low-rank approximation.What each panel shows
One panel is drawn per unique value in
edata.obs[cluster_key], arranged in two columns. The panel title shows the cluster label, the number of observations, and the dominant NCP component.Within each panel, each line is one variable. The y-axis is the mean value (or mean probability, if
sigmoid_transform=True) of that variable across all observations belonging to the cluster, plotted at each time point along the x-axis. Lines therefore reveal:Level — which variables have the highest absolute values for this cluster (higher lines = more pronounced feature).
Shape — whether a variable rises, falls, peaks, or stays flat over time within the cluster.
Co-occurrence — variables that share a similar trajectory shape are likely driven by the same underlying mechanism.
How variables are chosen per cluster
The mean patient loading
A[mask].mean(axis=0)is computed for the cluster, giving a score per NCP component.The component with the highest score is called the dominant component.
The
n_top_diseasesvariables with the highest loading in that component’s variable factorB[:, dominant]are selected.
This means each cluster is represented by the clinical variables that the NCP model considers most characteristic of it, providing a direct link between the data-driven decomposition and the cluster structure.
Requires
ncp()to have been run first.- Parameters:
edata (
EHRData) – Central data object.layer (
str) – Key of the 3D layer holding the raw values (shapen_obs × n_vars × n_time). All values must be non-negative (usesigmoid_transform=Truefor logit layers, ornp.abs/ clipping beforehand).cluster_key (
str) – Column inedata.obsthat contains cluster or group labels (any categorical or string column).key (
str, default:'ncp') – Key under which NCP results are stored (matcheskey_addedinncp()).n_top_diseases (
int, default:5) – Number of top-loaded variables to show per cluster.sigmoid_transform (
bool, default:False) – Apply a sigmoid transformation to the layer values before averaging. Set toTruewhen the layer stores raw logits so that the y-axis represents probabilities in(0, 1).width (
int, default:520) – Width of each panel in pixels.height (
int, default:300) – Height of each panel in pixels.
- Return type:
- Returns:
HoloViews Layout with one panel per cluster, arranged in two columns.
Examples
>>> import ehrdata as ed, ehrapy as ep
>>> edata = ed.dt.ehrdata_blobs(n_variables=8, n_centers=3, n_observations=30, base_timepoints=12)
>>> ep.tl.ncp(edata, layer="tem_data", rank=3, sigmoid_transform=True)
>>> ep.pl.ncp_cluster_trajectories(edata, layer="tem_data", cluster_key="cluster")