ehrapy.plot.clustermap#
- ehrapy.plot.clustermap(edata, obs_keys=None, use_raw=None, show=None, save=None, **kwds)[source]#
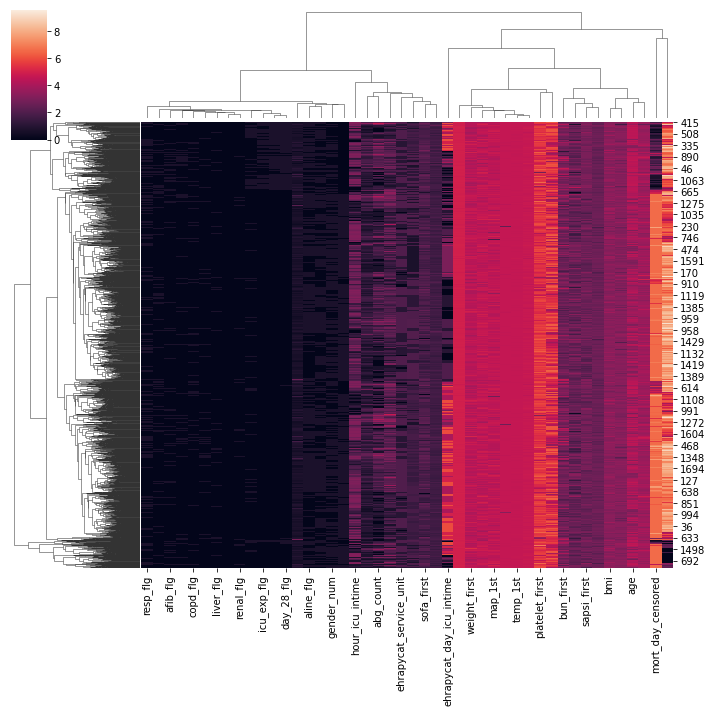
Hierarchically-clustered heatmap.
Wraps
seaborn.clustermap()for Data.- Parameters:
obs_keys (
str|None, default:None) – Categorical annotation to plot with a different color map. Currently, only a single key is supported.use_raw (
bool|None, default:None) – Whether to use raw attribute of edata. Defaults to True if .raw is present.show (
bool|None, default:None) – Whether to display the figure or return axis.save (
bool|str|None, default:None) – If True or a str, save the figure. A string is appended to the default filename. Infer the filetype if ending on {‘.pdf’, ‘.png’, ‘.svg’}.ax – A matplotlib axes object. Only works if plotting a single component.
**kwds – Keyword arguments passed to
clustermap().
- Returns:
If show is False, a seaborn.ClusterGrid object (see
clustermap()).
Example
import ehrdata as ed
import ehrapy as ep

edata = ed.dt.mimic_2()
ep.pp.knn_impute(edata)
ep.pp.log_norm(edata, offset=1)
ep.pp.neighbors(edata)
ep.tl.leiden(edata, resolution=0.5, key_added="leiden_0_5")
ep.pl.clustermap(edata)
- Preview: