ehrapy.plot.cox_ph_adjusted_curves#
- ehrapy.plot.cox_ph_adjusted_curves(edata, *, uns_key='cox_ph_adjusted_curves', groups=None, palette=None, show_ci=True, ci_alpha=0.15, line_width=2.0, width=650, height=450, title=None, xlabel='Time', ylabel='Adjusted Survival Probability', legend_position='top_right')[source]#
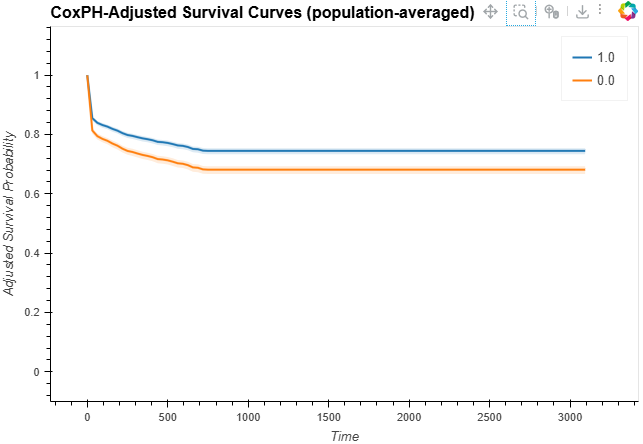
Survival curve plot to visualize CoxPH-adjusted survival probabilities stratified by a grouping variable.
The edata object must first be populated using
cox_ph_adjusted_curves(). Mirrors the functionality of ggadjustedcurves() from the R survminer package. See also: Therneau, Crowson & Atkinson (2015), ‘Adjusted Survival Curves’: https://cran.r-project.org/web/packages/survival/vignettes/adjcurve.pdf- Parameters:
edata (
EHRData) – Data object containing the adjusted survival curves in uns after having runcox_ph_adjusted_curves().uns_key (
str, default:'cox_ph_adjusted_curves') – Key in .uns wherecox_ph_adjusted_curves()stored its output. See argument key_added incox_ph_adjusted_curves().groups (
Sequence[str] |None, default:None) – Subset of group labels to plot. If None, all groups are plotted.palette (
Sequence[str] |None, default:None) – List of hex or named colors, one per group.show_ci (
bool, default:True) – Whether to draw confidence interval bands. Only has an effect when method=’average’ was used, as method=’conditional’ does not produce confidence intervals.ci_alpha (
float, default:0.15) – Transparency of the CI band fill between 0 and 1.line_width (
float, default:2.0) – Line width for the survival curves.width (
int, default:650) – Plot width in pixels.height (
int, default:450) – Plot height in pixels.title (
str|None, default:None) – Set the title of the plot.xlabel (
str, default:'Time') – X-axis label.ylabel (
str, default:'Adjusted Survival Probability') – Y-axis label.legend_position (
str, default:'top_right') – Position of the legend.
- Return type:
- Returns:
HoloViews Overlay object representing the adjusted survival curve plot.
Examples
>>> import ehrdata as ed
>>> import ehrapy as ep
>>> edata = ed.dt.mimic_2()
>>> cph = ep.tl.cox_ph(
...     edata, "mort_day_censored", "censor_flg", formula="gender_num + afib_flg + day_icu_intime_num"
... )
>>> ep.tl.cox_ph_adjusted_curves(
...     edata,
...     cph,
...     strata="aline_flg",
...     duration_col="mort_day_censored",
...     event_col="censor_flg",
... )
>>> ep.pl.cox_ph_adjusted_curves(edata)