ehrapy.plot.ols#
- ehrapy.plot.ols(adata=None, x=None, y=None, scatter_plot=True, ols_results=None, ols_color=None, xlabel=None, ylabel=None, figsize=None, lines=None, lines_color=None, lines_style=None, lines_label=None, xlim=None, ylim=None, show=None, ax=None, title=None, **kwds)[source]#
Plots a Ordinary Least Squares (OLS) Model result, scatter plot, and line plot.
- Parameters:
adata (
Optional[AnnData]) –AnnDataobject object containing all observations.scatter_plot (
Optional[bool]) – If True, show scatter plot. Defaults to True.ols_results (
Optional[list[RegressionResults]]) – List of RegressionResults from ehrapy.tl.ols. Example: [result_1, result_2]ols_color (
Optional[list[str]]) – List of colors for each ols_results. Example: [‘red’, ‘blue’].figsize (
Optional[tuple[float,float]]) – Width, height in inches. Defaults to None.lines (
Optional[list[tuple[ndarray|float,ndarray|float]]]) – List of Tuples of (slope, intercept) or (x, y). Plot lines by slope and intercept or data points. Example: plot two lines (y = x + 2 and y = 2*x + 1): [(1, 2), (2, 1)]lines_color (
Optional[list[str]]) – List of colors for each line. Example: [‘red’, ‘blue’]lines_style (
Optional[list[str]]) – List of line styles for each line. Example: [‘-’, ‘–‘]lines_label (
Optional[list[str]]) – List of line labels for each line. Example: [‘Line1’, ‘Line2’]xlim (
Optional[tuple[float,float]]) – Set the x-axis view limits. Required for only plotting lines using slope and intercept.ylim (
Optional[tuple[float,float]]) – Set the y-axis view limits. Required for only plotting lines using slope and intercept.ax (
Optional[Axes]) – A matplotlib axes object. Only works if plotting a single component.
Examples
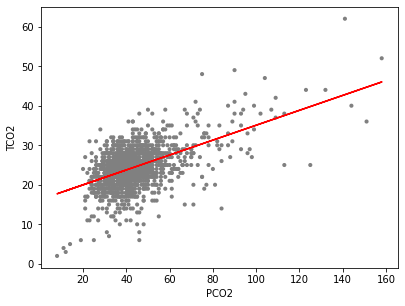
>>> import ehrapy as ep
>>> adata = ep.dt.mimic_2(encoded=False)
>>> co2_lm_result = ep.tl.ols(adata, var_names=['pco2_first', 'tco2_first'], formula='tco2_first ~ pco2_first', missing="drop").fit()
>>> ep.pl.ols(adata, x='pco2_first', y='tco2_first', ols_results=[co2_lm_result], ols_color=['red'], xlabel="PCO2", ylabel="TCO2")
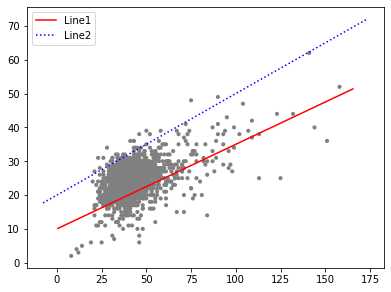
>>> import ehrapy as ep
>>> adata = ep.dt.mimic_2(encoded=False)
>>> ep.pl.ols(adata, x='pco2_first', y='tco2_first', lines=[(0.25, 10), (0.3, 20)],
>>>           lines_color=['red', 'blue'], lines_style=['-', ':'], lines_label=['Line1', 'Line2'])
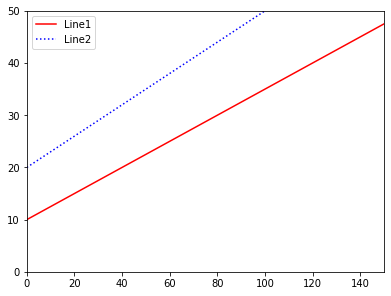
>>> import ehrapy as ep
>>> ep.pl.ols(lines=[(0.25, 10), (0.3, 20)], lines_color=['red', 'blue'], lines_style=['-', ':'],
>>>           lines_label=['Line1', 'Line2'], xlim=(0, 150), ylim=(0, 50))