ehrapy.plot.rank_features_groups_matrixplot#
- ehrapy.plot.rank_features_groups_matrixplot(adata, groups=None, n_features=None, groupby=None, values_to_plot=None, var_names=None, feature_symbols=None, min_logfoldchange=None, key='rank_features_groups', show=None, save=None, return_fig=False, **kwds)[source]#
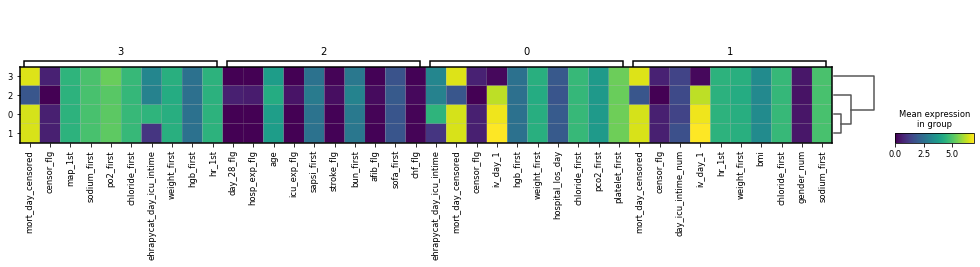
Plot ranking of genes using matrixplot plot (see
matrixplot())- Parameters:
adata (
AnnData) – Annotated data matrix.groups (
Union[str,Sequence[str],None]) – List of group names.n_features (
Optional[int]) – Number of features to show. Is ignored if feature_names is passed.groupby (
Optional[str]) – Which key to group the features by.feature_symbols (
Optional[str]) – Key for field in .var that stores feature symbols if you do not want to use .var_names displayed in the plot.values_to_plot (
Optional[Literal['scores','logfoldchanges','pvals','pvals_adj','log10_pvals','log10_pvals_adj']]) – Key to plot. One of ‘scores’, ‘logfoldchanges’, ‘pvals’, ‘pvalds_adj’, ‘log10_pvals’, ‘log10_pvalds_adj’.var_names (
Union[Sequence[str],Mapping[str,Sequence[str]],None]) – Feature names.min_logfoldchange (
Optional[float]) – Minimum log fold change to consider.key (
Optional[str]) – The key of the calculated feature group rankings (default: ‘rank_features_groups’).return_fig (
Optional[bool]) – ReturnsStackedViolinobject. Useful for fine-tuning the plot. Takes precedence over show=False.
- Returns:
If return_fig is True, returns a
MatrixPlotobject, else if show is false, return axes dict
Example
>>> import ehrapy as ep
>>> adata = ep.data.mimic_2(encoded=True)
>>> ep.pp.knn_impute(adata)
>>> ep.pp.neighbors(adata)
>>> ep.tl.leiden(adata, resolution=0.5, key_added="leiden_0_5")
>>> ep.tl.rank_features_groups(adata, groupby="leiden_0_5")
>>> ep.pl.rank_features_groups_matrixplot(adata, key="rank_features_groups", groupby="leiden_0_5")
- Preview: