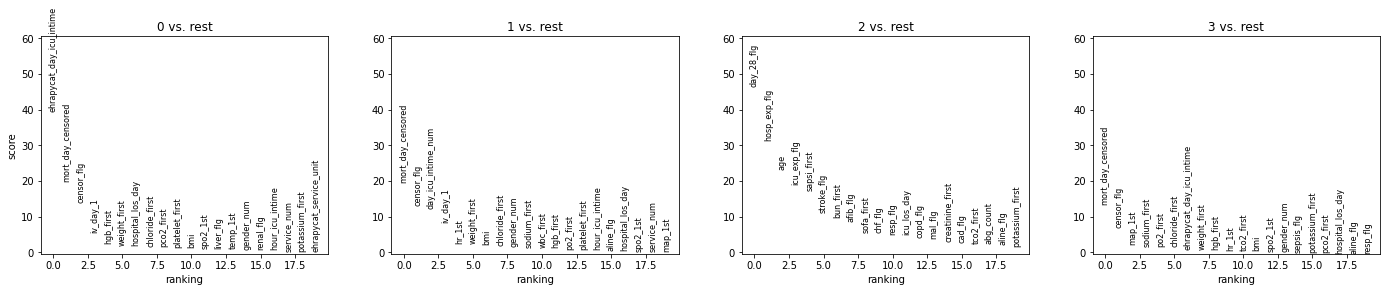
ehrapy.plot.rank_features_groups#
- ehrapy.plot.rank_features_groups(edata, groups=None, n_features=20, feature_symbols=None, key='rank_features_groups', fontsize=8, ncols=4, share_y=True, show=None, save=None, ax=None, **kwds)[source]#
Plot ranking of features.
- Parameters:
groups (
str|Sequence[str] |None, default:None) – The groups for which to show the feature ranking.n_features (
int, default:20) – The number of features to plot.feature_symbols (
str|None, default:None) – Key for field in .var that stores feature symbols if you do not want to use .var_names.key (
str|None, default:'rank_features_groups') – The key of the calculated feature group rankings (default: ‘rank_features_groups’).fontsize (
int, default:8) – Fontsize for feature names.ncols (
int, default:4) – Number of panels shown per row.share_y (
bool, default:True) – Controls if the y-axis of each panels should be shared. But passing sharey=False, each panel has its own y-axis range.show (
bool|None, default:None) – Whether to display the figure or return axis.save (
bool|None, default:None) – If True or a str, save the figure. A string is appended to the default filename. Infer the filetype if ending on {‘.pdf’, ‘.png’, ‘.svg’}.ax (
Axes|None, default:None) – A matplotlib axes object. Only works if plotting a single component.
Examples
>>> import ehrdata as ed
>>> import ehrapy as ep
>>> edata = ed.dt.mimic_2()
>>> ep.pp.knn_impute(edata)
>>> ep.pp.log_norm(edata, offset=1)
>>> ep.pp.neighbors(edata)
>>> ep.tl.leiden(edata, resolution=0.15, key_added="leiden_0_5")
>>> ep.tl.rank_features_groups(edata, groupby="leiden_0_5")
>>> ep.pl.rank_features_groups(edata, key="rank_features_groups")
- Preview: