ehrapy.plot.ncp#
- ehrapy.plot.ncp(edata, *, key='ncp', n_top=12, width=380, height=280)[source]#
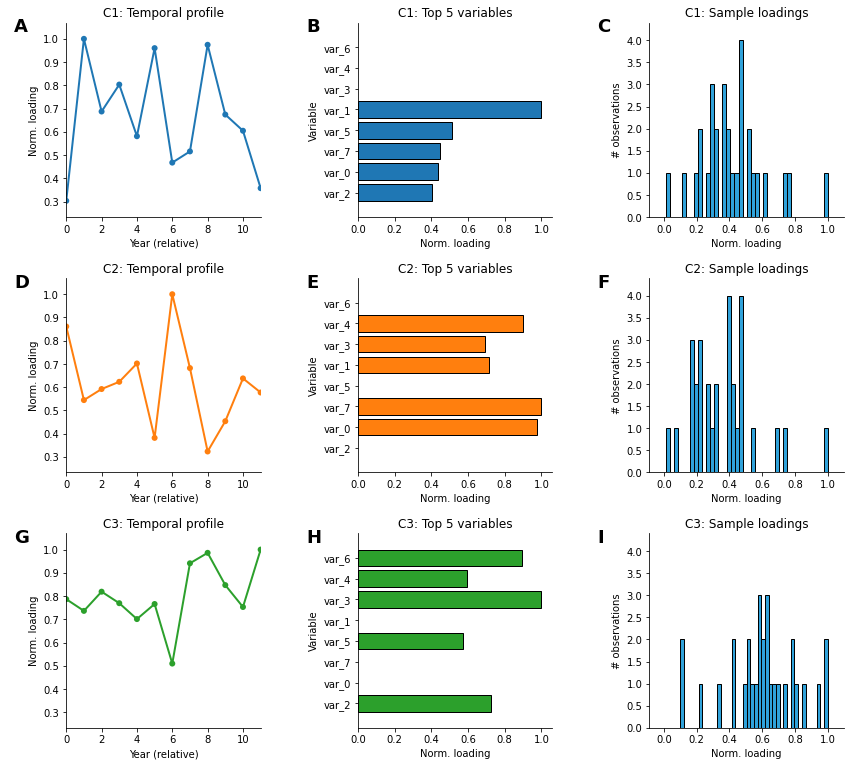
Plot the factors from a Non-negative CP decomposition.
For each component, three side-by-side panels are shown:
Temporal profile – normalised time factor, showing how the risk pattern evolves across the time axis.
Top variables – horizontal bar chart of the
n_topvariables with the highest loading in this component.Sample loadings – histogram of per-observation loadings, revealing whether the component is diffuse (broad distribution) or selective (heavy right tail).
Requires
ncp()to have been run first.- Parameters:
edata (
EHRData) – Central data object containing NCP results.key (
str, default:'ncp') – Key under which NCP results are stored (matcheskey_addedinncp()).n_top (
int, default:12) – Number of top-loaded variables to display per component.width (
int, default:380) – Width of each individual panel in pixels.height (
int, default:280) – Height of each individual panel in pixels.
- Return type:
- Returns:
HoloViews Layout with
rank × 3panels arranged in three columns.
Examples
>>> import numpy as np, pandas as pd
>>> import ehrdata as ed, ehrapy as ep
>>> np.random.seed(0)
>>> tensor = np.abs(np.random.randn(30, 8, 12))
>>> edata = ed.EHRData(
...     shape=(30, 8),
...     layers={"data": tensor},
...     var=pd.DataFrame(index=[f"var_{i}" for i in range(8)]),
... )
>>> ep.tl.ncp(edata, layer="data", rank=3)
>>> ep.pl.ncp(edata, n_top=5)