ehrapy.plot.dendrogram#
- ehrapy.plot.dendrogram(edata, groupby, *, dendrogram_key=None, orientation='top', remove_labels=False, show=None, save=None, ax=None)[source]#
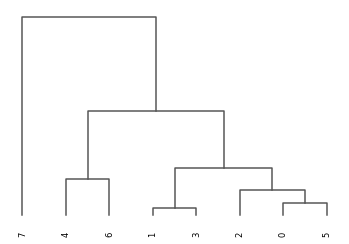
Plots a dendrogram of the categories defined in groupby.
See
dendrogram().- Parameters:
groupby (
str) – Categorical data column used to create the dendrogram.dendrogram_key (
str|None, default:None) – Key under with the dendrogram information was stored. By default the dendrogram information is stored under .uns[f’dendrogram_{groupby}’].orientation (
Literal['top','bottom','left','right'], default:'top') – Origin of the tree. Will grow into the opposite direction.remove_labels (
bool, default:False) – Don’t draw labels. Used e.g. byscanpy.pl.matrixplot()to annotate matrix columns/rows.show (
bool|None, default:None) – Whether to display the figure or return axis.save (
str|bool|None, default:None) – If True or a str, save the figure. A string is appended to the default filename. Infer the filetype if ending on {‘.pdf’, ‘.png’, ‘.svg’}.ax (
Axes|None, default:None) – A matplotlib axes object. Only works if plotting a single component.
- Return type:
Example
import ehrdata as ed
import ehrapy as ep

edata = ed.dt.mimic_2()
ep.pp.knn_impute(edata)
ep.pp.log_norm(edata, offset=1)
ep.pp.neighbors(edata)
ep.tl.leiden(edata, resolution=0.5, key_added="leiden_0_5")
ep.pl.dendrogram(edata, groupby="leiden_0_5")
- Preview: