ehrapy.plot.ncp_cluster_trajectories#
- ehrapy.plot.ncp_cluster_trajectories(edata, *, layer, cluster_key, key='ncp', n_top_diseases=5, sigmoid_transform=False, width=520, height=300)[source]#
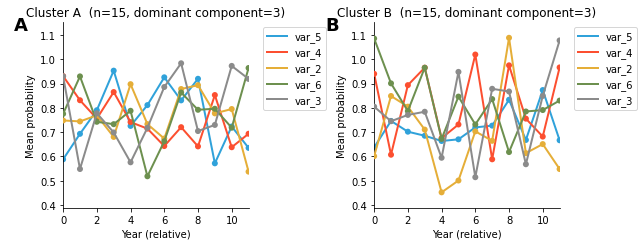
Plot mean disease-risk trajectories per cluster, guided by NCP loadings.
For each cluster defined by
cluster_keyinedata.obs:The dominant NCP component is identified (highest mean sample loading for that cluster).
The
n_top_diseasesvariables with the highest loading in that component are selected.Mean probability trajectories over the time axis are plotted for those variables, averaged across all observations in the cluster.
Requires
ncp()to have been run first.- Parameters:
edata (
EHRData) – Central data object.layer (
str) – Key of the 3D layer holding the raw values (shapen_obs × n_vars × n_time).cluster_key (
str) – Column inedata.obswith cluster/group labels.key (
str, default:'ncp') – Key under which NCP results are stored.n_top_diseases (
int, default:5) – Number of top variables to show per cluster.sigmoid_transform (
bool, default:False) – Apply sigmoid to the layer values before averaging. Set toTruewhen the layer stores raw logits.width (
int, default:520) – Width of each panel in pixels.height (
int, default:300) – Height of each panel in pixels.
- Return type:
- Returns:
HoloViews Layout with one panel per cluster, arranged in two columns.
Examples
>>> import numpy as np, pandas as pd
>>> import ehrdata as ed, ehrapy as ep
>>> np.random.seed(0)
>>> tensor = np.abs(np.random.randn(30, 8, 12))
>>> obs = pd.DataFrame(
...     {"group": ["A"] * 15 + ["B"] * 15},
...     index=[str(i) for i in range(30)],
... )
>>> edata = ed.EHRData(
...     shape=(30, 8),
...     layers={"data": tensor},
...     obs=obs,
...     var=pd.DataFrame(index=[f"var_{i}" for i in range(8)]),
... )
>>> ep.tl.ncp(edata, layer="data", rank=3)
>>> ep.pl.ncp_cluster_trajectories(edata, layer="data", cluster_key="group")