ehrapy.plot.rank_features_groups_violin#
- ehrapy.plot.rank_features_groups_violin(edata, groups=None, n_features=20, feature_names=None, feature_symbols=None, key=None, split=True, scale='width', strip=True, jitter=True, size=1, ax=None, show=None, save=None)[source]#
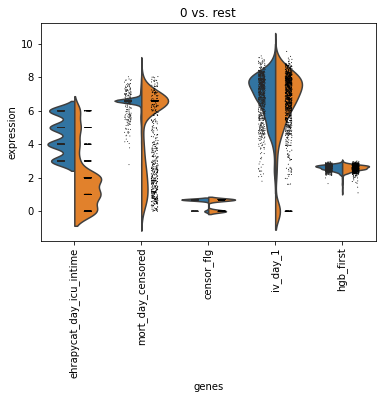
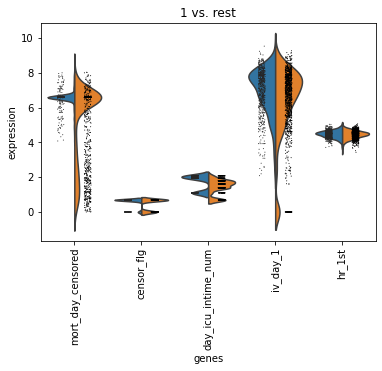
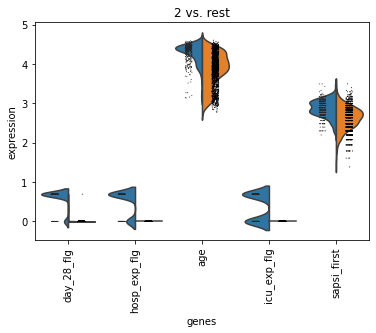
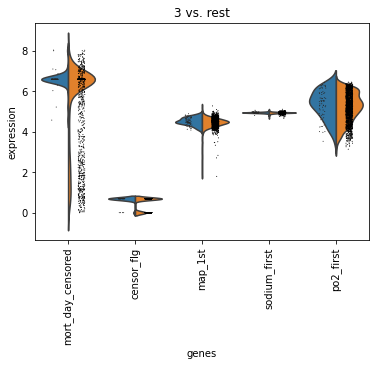
Plot ranking of features for all tested comparisons as violin plots.
- Parameters:
groups (
Sequence[str] |None, default:None) – List of group names.n_features (
int, default:20) – Number of features to show. Is ignored if feature_names is passed.feature_names (
Iterable[str] |None, default:None) – List of features to plot. Is only useful if interested in a custom feature list, which is not the result ofrank_features_groups().feature_symbols (
str|None, default:None) – Key for field in .var that stores feature symbols if you do not want to use .var_names displayed in the plot.key (
str|None, default:None) – The key of the calculated feature group rankings (default: ‘rank_features_groups’).split (
bool, default:True) – Whether to split the violins or not.scale (
str, default:'width') – Seeviolinplot().strip (
bool, default:True) – Show a strip plot on top of the violin plot.jitter (
int|float|bool, default:True) – If set to 0, no points are drawn. Seestripplot().size (
int, default:1) – Size of the jitter points.show (
bool|None, default:None) – Whether to display the figure or return axis.save (
bool|None, default:None) – If True or a str, save the figure. A string is appended to the default filename. Infer the filetype if ending on {‘.pdf’, ‘.png’, ‘.svg’}.ax (
Axes|None, default:None) – A matplotlib axes object. Only works if plotting a single component.
Examples
>>> import ehrdata as ed
>>> import ehrapy as ep
>>> edata = ed.dt.mimic_2()
>>> ep.pp.knn_impute(edata)
>>> ep.pp.log_norm(edata, offset=1)
>>> ep.pp.neighbors(edata)
>>> ep.tl.leiden(edata, resolution=0.15, key_added="leiden_0_5")
>>> ep.tl.rank_features_groups(edata, groupby="leiden_0_5")
>>> ep.pl.rank_features_groups_violin(edata, key="rank_features_groups", n_features=5)
- Preview: