ehrapy.plot.pca_loadings#
- ehrapy.plot.pca_loadings(edata, components=None, include_lowest=True, show=None, save=None)[source]#
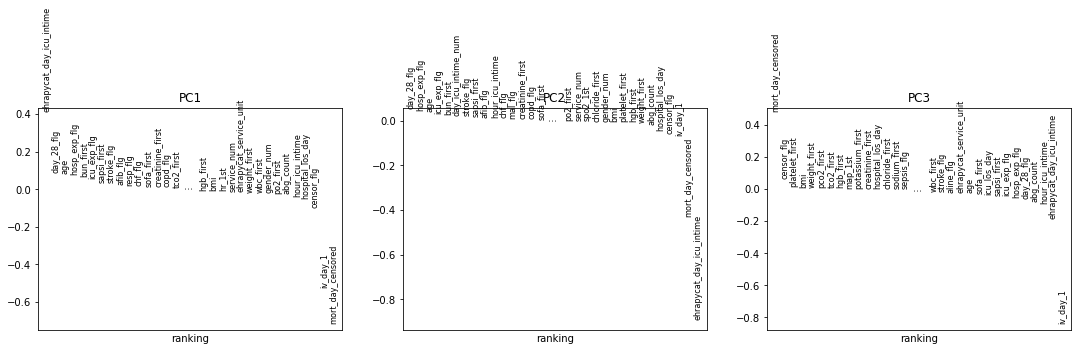
Rank features according to contributions to PCs.
- Parameters:
components (
str|Sequence[int] |None, default:None) – For example,'1,2,3'means[1, 2, 3], first, second, third principal component.include_lowest (
bool, default:True) – Whether to show the features with both highest and lowest loadings.show (
bool|None, default:None) – Show the plot, do not return axis.save (
str|bool|None, default:None) – If True or a str, save the figure. A string is appended to the default filename. Infer the filetype if ending on {‘.pdf’, ‘.png’, ‘.svg’}.
- Return type:
Examples
>>> import ehrdata as ed
>>> import ehrapy as ep
>>> edata = ed.dt.mimic_2()
>>> ep.pp.knn_impute(edata)
>>> ep.pp.log_norm(edata, offset=1)
>>> ep.pp.neighbors(edata)
>>> ep.pp.pca(edata)
>>> ep.pl.pca_loadings(edata, components="1,2,3")
- Preview: