ehrapy.plot.cox_ph_forestplot
- ehrapy.plot.cox_ph_forestplot(adata, *, uns_key='cox_ph', labels=None, fig_size=(10, 10), t_adjuster=0.1, ecolor='dimgray', size=3, marker='o', decimal=2, text_size=12, color='k', show=None, title=None)[source]
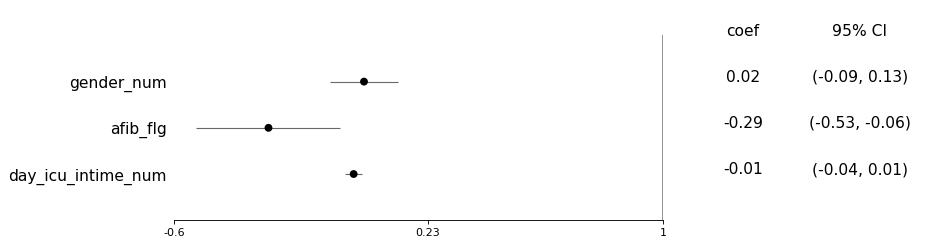
Generates a forest plot to visualize the coefficients and confidence intervals of a Cox Proportional Hazards model.
The adata object must first be populated using the
cox_ph()function. This function stores the summary table of the CoxPHFitter in the .uns attribute of adata. The summary table is created when the model is fitted using thecox_ph()function. For more information on the CoxPHFitter, see the Lifelines documentation.Inspired by zepid.graphics.EffectMeasurePlot (zEpid Package, https://pypi.org/project/zepid/).
- Parameters:
adata (
AnnData) –AnnDataobject containing the summary table from the CoxPHFitter. This is stored in the .uns attribute, after fitting the model usingcox_ph().uns_key (
str, default:'cox_ph') – Key in .uns wherecox_ph()function stored the summary table. See argument uns_key incox_ph().labels (
Iterable[str] |None, default:None) – List of labels for each coefficient, default uses the index of the summary tafig_size (
tuple, default:(10, 10)) – Width, height in inches.t_adjuster (
float, default:0.1) – Adjust the table to the right.ecolor (
str, default:'dimgray') – Color of the error bars.size (
int, default:3) – Size of the markers.marker (
str, default:'o') – Marker style.decimal (
int, default:2) – Number of decimal places to display.text_size (
int, default:12) – Font size of the text.color (
str, default:'k') – Color of the markers.show (
bool, default:None) – Show the plot, do not return figure and axis.title (
str|None, default:None) – Set the title of the plot.
Examples
>>> import ehrapy as ep
>>> adata = ep.dt.mimic_2(encoded=False)
>>> adata_subset = adata[:, ["mort_day_censored", "censor_flg", "gender_num", "afib_flg", "day_icu_intime_num"]]
>>> coxph = ep.tl.cox_ph(adata_subset, event_col="censor_flg", duration_col="mort_day_censored")
>>> ep.pl.cox_ph_forestplot(adata_subset)